

Recently, during the use of qPCR instruments
many colleagues often have some questions
1. Is my experimental data reliable?
2. After the experiment is completed,
which data and images should I focus on
to meet the requirements?
3. What is the relationship between data and curves?
If the two are not synchronized,
can the data still be used?
and other questions...
Then let's discuss these issues with everyone next.

What we usually need to pay attention to are
01 Cq Value
First and foremost is the Cq value: Cq value, also known as quantification cycle, refers to the number of cycles at which the sample reaction exceeds the fluorescence threshold, indicating the detection result of the target nucleic acid. A lower Cq value indicates a higher initial amount of the target sequence. There are many factors that affect the Cq value, and these factors need to be controlled during the experiment to ensure the accuracy and authenticity of the Cq value. The Delta-Delta Cq normalization method, by introducing reference genes, can distinguish the real concentration changes of target sequences caused by biological feedback changes from technical operation issues.
Tips: Different Terminologies for Cq Value
Ct – cycle threshold/threshold cycle
Cp – crossing point
TOP – take-off point
Cq – quantification cycle
All these terms refer to the same concept as Cq value, just with different names. To standardize qPCR nomenclature, the MIQE (minimum information for publication of quantitative real-time PCR experiments) guidelines recommend the use of Cq value.)
Under normal circumstances, we evaluate Cq value results according to the following standards:
• Excellent: The Cq value of reference genes is between 14-18, and the Cq value of target genes should also be between 14-18.
• Good: The Cq value of reference genes is between 12-20, while the Cq value of target genes should be between 14-32.
• Fair: The Cq value of reference genes is between 10-22, and the Cq value of target genes is between 14-35. However, if the Cq value of the target gene exceeds 35, although the data can still be used, it may affect the accuracy of the experimental results and lead to large deviations. Therefore, if a high Cq value is found, it is recommended to repeat the experiment to ensure the accuracy of the results.
02 Melting Curve
In addition to the Cq value mentioned above, another thing we usually need to pay attention to is the melting curve, which is essential to ensure the accuracy and reliability of experimental results.
When checking the melting curve, we need to focus on the following aspects:
• Melting Temperature (TM value): The melting temperature should be between 75-90℃, which is a relatively appropriate range.
• Peak Shape: The peak shape should be a single peak without any miscellaneous peaks.
• Peak Distance: Ideally, the peak distance should be within 5 TM units to ensure the accuracy and reliability of experimental results.

(Image from Archimed X4 experimental data)
Interpretation of melting curve: According to our primer design principles, if the length of the amplification product is in the range of 80-300bp, the melting temperature should be between 80℃-90℃.
Therefore, if a unique main peak appears between 80℃-90℃, it indicates that the quantitative real-time PCR is perfect; if a main peak appears between 80℃-90℃ and a miscellaneous peak appears below 80℃, primer dimers are basically considered, and increasing the annealing temperature can be tried to solve the problem; if a main peak appears between 80℃-90℃ and a miscellaneous peak appears as the temperature rises, DNA contamination is basically considered, and DNA needs to be removed at the initial stage of the experiment.
03 Amplification Curve
A standard amplification curve should be close to an S-shape.

(Image from Archimed X4 experimental data)
• Plateau Phase: It is necessary to observe whether the curve has an obvious plateau phase. The clarity of the plateau phase is crucial for the accuracy and reliability of the results. In cases of low concentration, there may be no obvious plateau phase.
• Secondary Amplification: It is necessary to observe whether the curve rises again during amplification. A normal curve should not rise again during the amplification process. If secondary amplification occurs, it will affect our accurate understanding of the amplification process, so special attention is needed.
Tips: Common knowledge about amplification curves
(1) Amplification curve: Smooth S-shaped curve.
(2) Cq value is in the range of 15-35.
(3) Data can be used even without a plateau phase.
(4) Baseline is usually at 3-15 cycles.
(5) If the Cq value exceeds 35, the reliability of the data needs to be judged.
(6) 3 technical replicates, and the difference in Cq values of replicates should not exceed 0.5.
04 Standard Curve
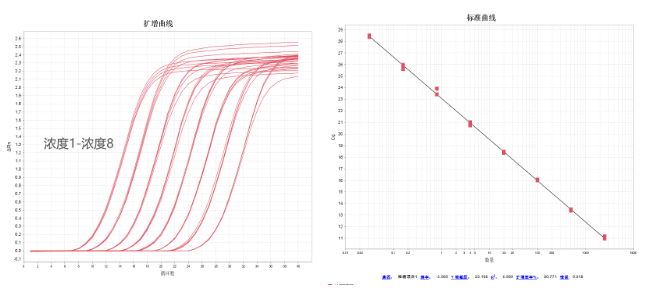
The above three points can basically meet our routine judgment on whether the qPCR experimental data meets our requirements, but there is an additional thing that some colleagues may encounter: the standard curve. In pharmaceutical applications, many colleagues need to construct standard curves.
The construction process of the standard curve is roughly divided into:
(1) Sample Preparation: Select a series of nucleic acid samples (such as DNA or RNA) with known concentrations. The concentrations of these samples should be within the expected concentration range of the experiment and as close as possible to the samples to be used in the experiment.
(2) qPCR Amplification: Perform qPCR amplification on these samples with different concentrations and record the amplification process of each sample.
(3) Data Analysis: Plot the result curve with the logarithm of the initial template copy number as the X-axis and the Cq value as the Y-axis. This curve is the standard curve of qPCR.
(Image from Archimed X4 experimental data)
Criteria for judging the quality of standard curves:
(1) Linear standard curve (R2>0.980 or R greater than |-0.990|).
(2) Amplification efficiency (90~110%).
(3) Slope range -3.58~-3.10.
(4) At least 3 technical replicates.
Through the above four points
we can basically satisfy
the judgment of the reliability of our experimental data

Of course
the presentation of excellent experimental results
depends not only on the accurate experimental operation
but also on the choice of excellent experimental equipment
For example
Rocgene Archimed Series qPCR Instrument
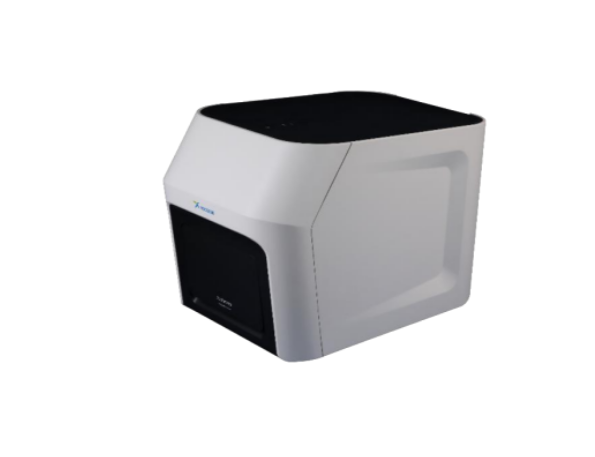
The Archimed series quantitative real-time PCR instrument is the world's first time-resolved real-time fluorescent quantitative PCR system meticulously built by Rocgene's international senior technical team, drawing on the essence of the development of quantitative PCR technology. Based on the new optical path system of Fresnel lens, patented time-resolved signal acquisition technology and unique temperature control technology, Archimed has higher detection sensitivity, more excellent temperature control accuracy and uniformity, more convenient operation process, and more comprehensive analysis functions. At the same time, based on the global vision of product design concept and manufacturing process, Archimed is endowed with excellent quality of international standards.

06
16
08
18


 +86-010-86229225
 info@rocgene.com
 CN
CN